
Interactive ads vs. video is an argument that plays out in the same conference room at every media plan review. Someone on the creative side wants to build something interactive. Someone on the media buying side wants to know why they’d spend three times the production budget on a banner that “does the same job” as a 15-second video. Both sides usually have half a point, and neither has looked at the actual 2026 numbers in the same place at the same time.
So here they are, side by side: engagement rate, click-through rate, conversion lift, and completion data for static, video, and interactive ad formats, pulled from ad-network reporting, IAB research, and platform benchmark data. Not to declare a winner — the honest answer depends on what you’re buying — but to give you the numbers to make that call yourself instead of relying on whichever format your last agency happened to specialize in.
1. The Three Formats, Defined Fast
Static ads are a fixed image and a message — a banner, a display unit, a single-image social post. No motion, no interaction, lowest cost and fastest to produce.
Video ads add motion and sound over a fixed runtime, usually 6 to 30 seconds. The viewer watches; they don’t act until the CTA appears (if they’re still there by then).
Interactive ads ask the viewer to do something before the message lands — tap, drag, swipe, answer, configure, or play. This covers a wider category than most people realize: playable ads, interactive video (embedded polls, branching choices, shoppable hotspots), gamified quizzes, and product configurators all fall under this umbrella. We’ve written a full breakdown of playable ads specifically if that’s the format you’re evaluating; this piece looks at the wider category and how it stacks up against the two formats it’s replacing.
2. Engagement Rate: The 2026 Numbers
Engagement rate means something slightly different per format — view-through for video, play rate for interactive, click rate for static — which is exactly why so many media plans compare them incorrectly. Here’s how the ranges actually line up:
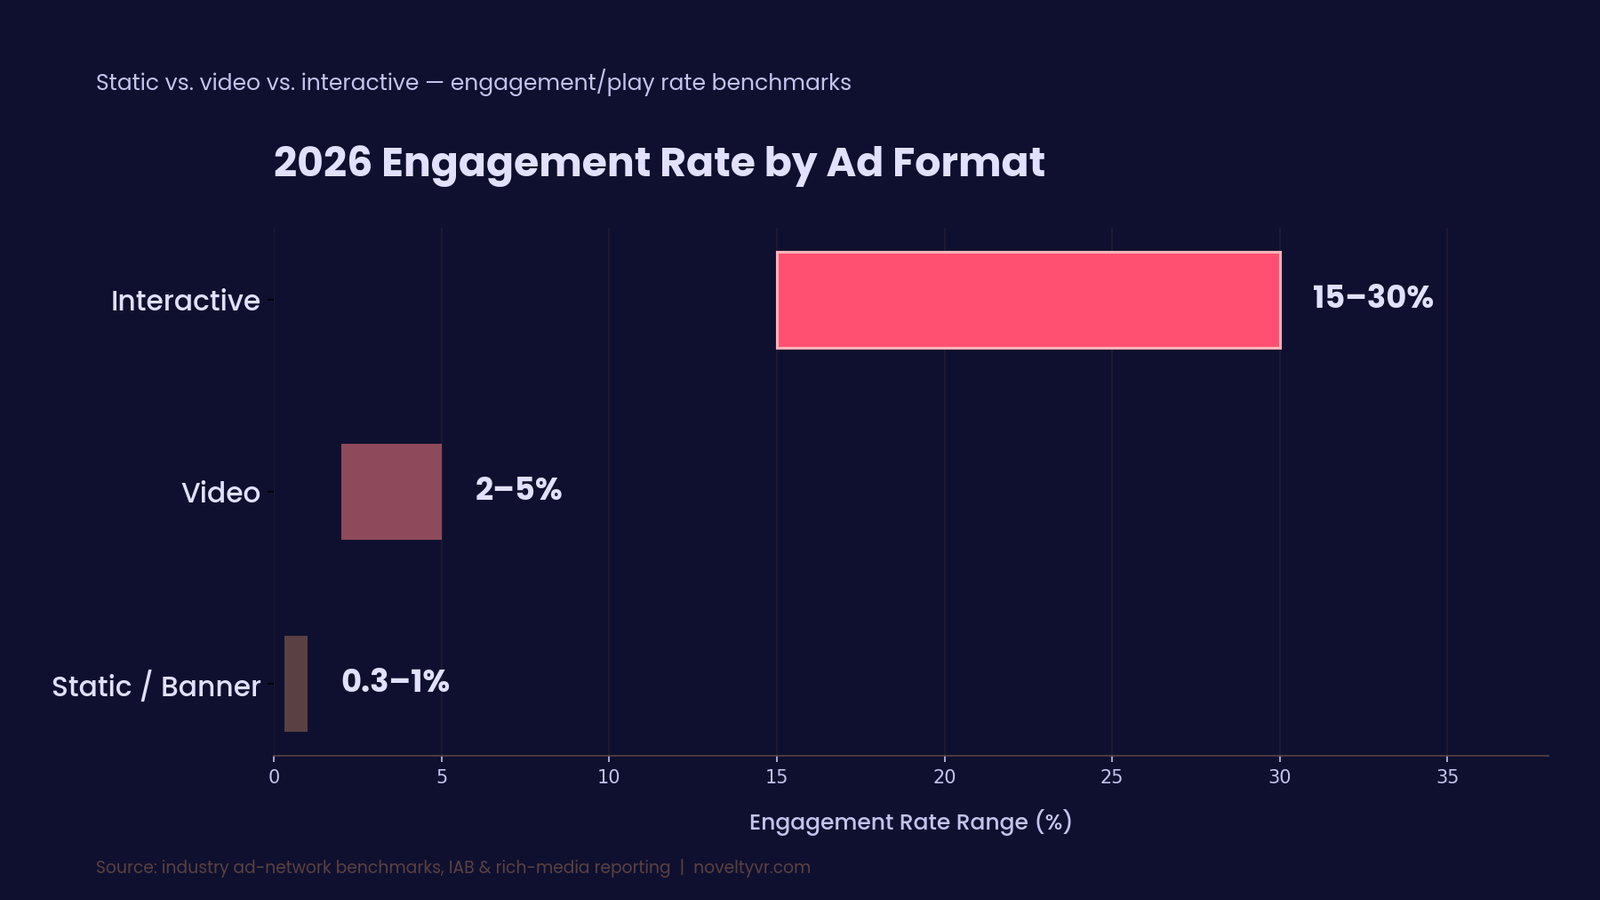
| Format | Typical Engagement Rate | Click-Through Rate | Notes |
|---|---|---|---|
| Static / Banner | Under 1% | ~0.12% (standard banner) | Lowest cost, lowest ceiling |
| Video | 2–5% view-through | 2–4x static CTR | Completion drops sharply after :15 |
| Rich Media / Interactive | 15–30% play rate | ~0.44% (rich media benchmark), up to 700% higher than static in mini-game formats | Engagement measured by action, not just view |
The banner-vs-rich-media CTR gap (0.12% vs. 0.44%) has been a stable industry benchmark for years and holds up in 2026 data — interactive units still pull roughly 3–4x the raw click activity of a static equivalent. Where the numbers get more dramatic is in mini-game and playable formats specifically, where ad-network reporting has shown CTR lifts of up to 700% over static creative in the same placement. That’s not a typo; it’s what happens when the ad asks for a thumb instead of just an eyeball.
Video sits in the middle by design — better than static because motion and sound capture attention involuntarily, worse than interactive because watching is still a passive act. The viewer hasn’t committed to anything yet.
3. Conversion and Click-Through: Where the Real Gap Shows Up
Engagement is the appetizer. Conversion is what the budget owner actually cares about, and this is where the format gap widens rather than narrows.
Shoppable video units — video with embedded, clickable product hotspots — report an average in-session purchase conversion rate around 14.2%, compared to roughly 3.4% for static display served in the same funnel position. That’s already a meaningful jump from adding any interactivity to video. Pure interactive formats push further: playable ad units have shown conversion lifts as high as 3x standard video creative in aggregate industry reporting, with some individual campaigns reporting considerably more.
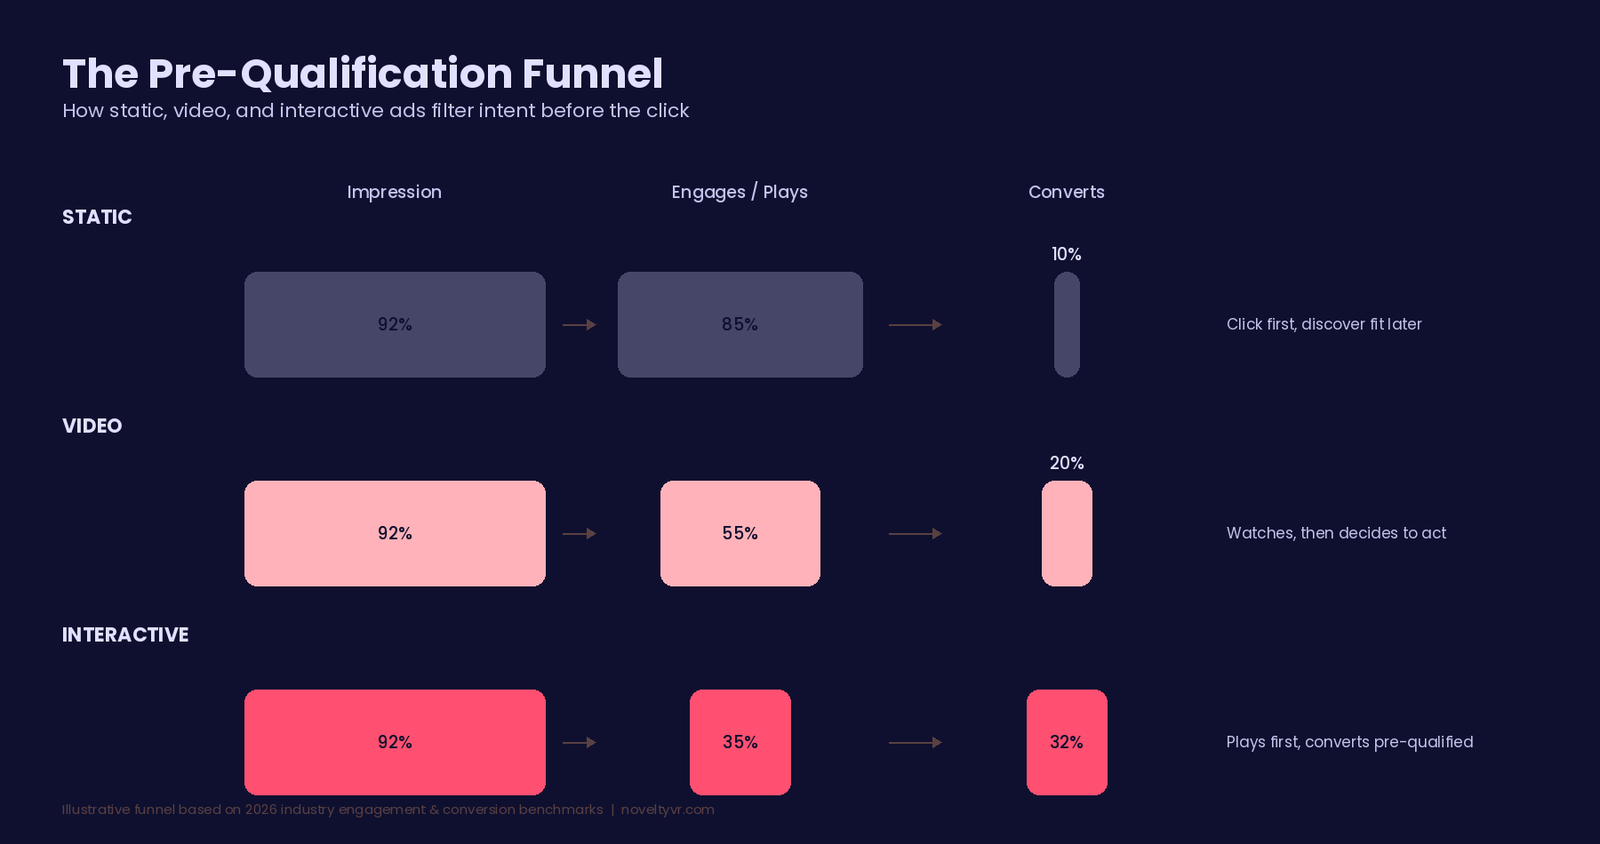
The mechanism is the same one we cover in more depth in our playable ads guide: interactive formats pre-qualify intent before the click happens. Someone who just played a 15-second mini-game already has an opinion about the product, formed through direct experience rather than a claim in a script. That’s a fundamentally different psychological starting point walking into the landing page than someone who clicked a banner on impulse and is now deciding whether to bounce.
Static ads aren’t conversion-dead — they still work at scale for retargeting warm audiences who’ve already formed intent elsewhere — but as a cold-traffic conversion driver, they’re consistently the weakest of the three formats across every benchmark we reviewed.
4. Completion, Retention, and the Metric Most Teams Ignore
Everyone tracks CTR. Fewer teams track what happens after the click, which is a mistake, because it’s where the formats separate most clearly.
Video completion rates vary enormously by length and placement: a general benchmark sits around 40–60%, with well-optimized in-app and rewarded video units exceeding 75%. Short-form video (under 15 seconds) completes at a notably higher rate — close to 80% — than anything running past 30 seconds. The lesson buried in that data: if you’re building video, length is doing more work against you than creative quality is.
Interactive formats report engagement (play) rates in the 15–30% range — lower than video completion on paper, but measuring something categorically different. A completed video view means someone didn’t skip. A completed play session means someone actively participated for the full duration. When you follow both cohorts downstream, the interactive group consistently shows better post-conversion behavior: retention among users who convert after an interactive experience runs 30–40% higher than users who convert after passive video exposure, because the interactive group self-selected before they ever clicked through.
“The number that should actually drive format selection for performance-focused campaigns is the one most media plans never look at: what happens after the conversion, not just the click that led to it.”
5. Cost vs. Payoff: Is Interactive Worth the Extra Spend?
Production cost runs in the opposite direction of everything above, which is exactly why this decision isn’t obvious.
A static ad costs the least to produce — often a same-day turnaround. Video sits in the middle. A custom interactive unit — playable ad, configurator, gamified quiz — typically costs more upfront, usually landing somewhere between a video shoot and a small app build depending on mechanic complexity.
But production cost and media cost move independently, and that’s the part budget conversations tend to skip. Because interactive formats pre-qualify users before the click, advertisers running them frequently report 20–30% lower cost-per-acquisition than standard video at the media-spend level, even though the interactive asset cost more to build. You’re front-loading spend into the creative in exchange for a cheaper, higher-quality audience downstream — the opposite of how most teams are used to budgeting creative versus media, and worth spelling out explicitly to whoever signs off on the split.
The practical rule of thumb: if a campaign is running long enough and at enough volume that media spend will dwarf production cost, interactive almost always wins the total cost-per-outcome math. If it’s a short, low-volume flight, the production overhead may not have time to pay itself back.
6. When Video Still Wins
It would be dishonest to write this as a one-sided pitch for interactive, because video is still the right call in specific situations.
Pure brand storytelling. If the goal is emotional connection or narrative at scale — a launch film, a brand manifesto — video’s ability to control pacing, music, and voiceover does something interactive formats generally can’t replicate as well.
Broad-reach awareness with no performance goal. Video scales cheaper per impression across most platforms and doesn’t require the same device and platform-spec testing an interactive unit does. If the objective is pure reach, not action, video is the more efficient tool.
Complex products that need explaining before they can be experienced. Some products genuinely need 20 seconds of context before an interaction would make sense to a first-time viewer. Video is a better on-ramp in those cases; interactive can come later in the funnel.
7. When Static Still Makes Sense
Static isn’t obsolete, either. It remains the right choice for retargeting audiences who’ve already converted their intent elsewhere and just need a reminder nudge, for extremely low-budget test flights where you’re validating a message before investing in production, and for placements — certain programmatic display inventory, some email contexts — where motion and interactivity either aren’t supported or actively hurt load time and deliverability.
The mistake isn’t using static ads. It’s using only static ads for a cold-traffic, high-consideration campaign and wondering why conversion is flat.
8. A Simple Framework for Choosing
Strip away the nuance and it comes down to three questions:
What’s the funnel stage? Cold, high-consideration audiences respond best to interactive. Warm, already-convinced audiences convert fine on static or video.
What’s the campaign length and volume? High-volume, sustained campaigns amortize interactive production cost fastest. Short, one-off flights may not have time to recoup it.
What does the product actually need — explanation or experience? If understanding requires narrative and context, lead with video. If the value is obvious the moment someone touches it, interactive will out-convert everything else you try.
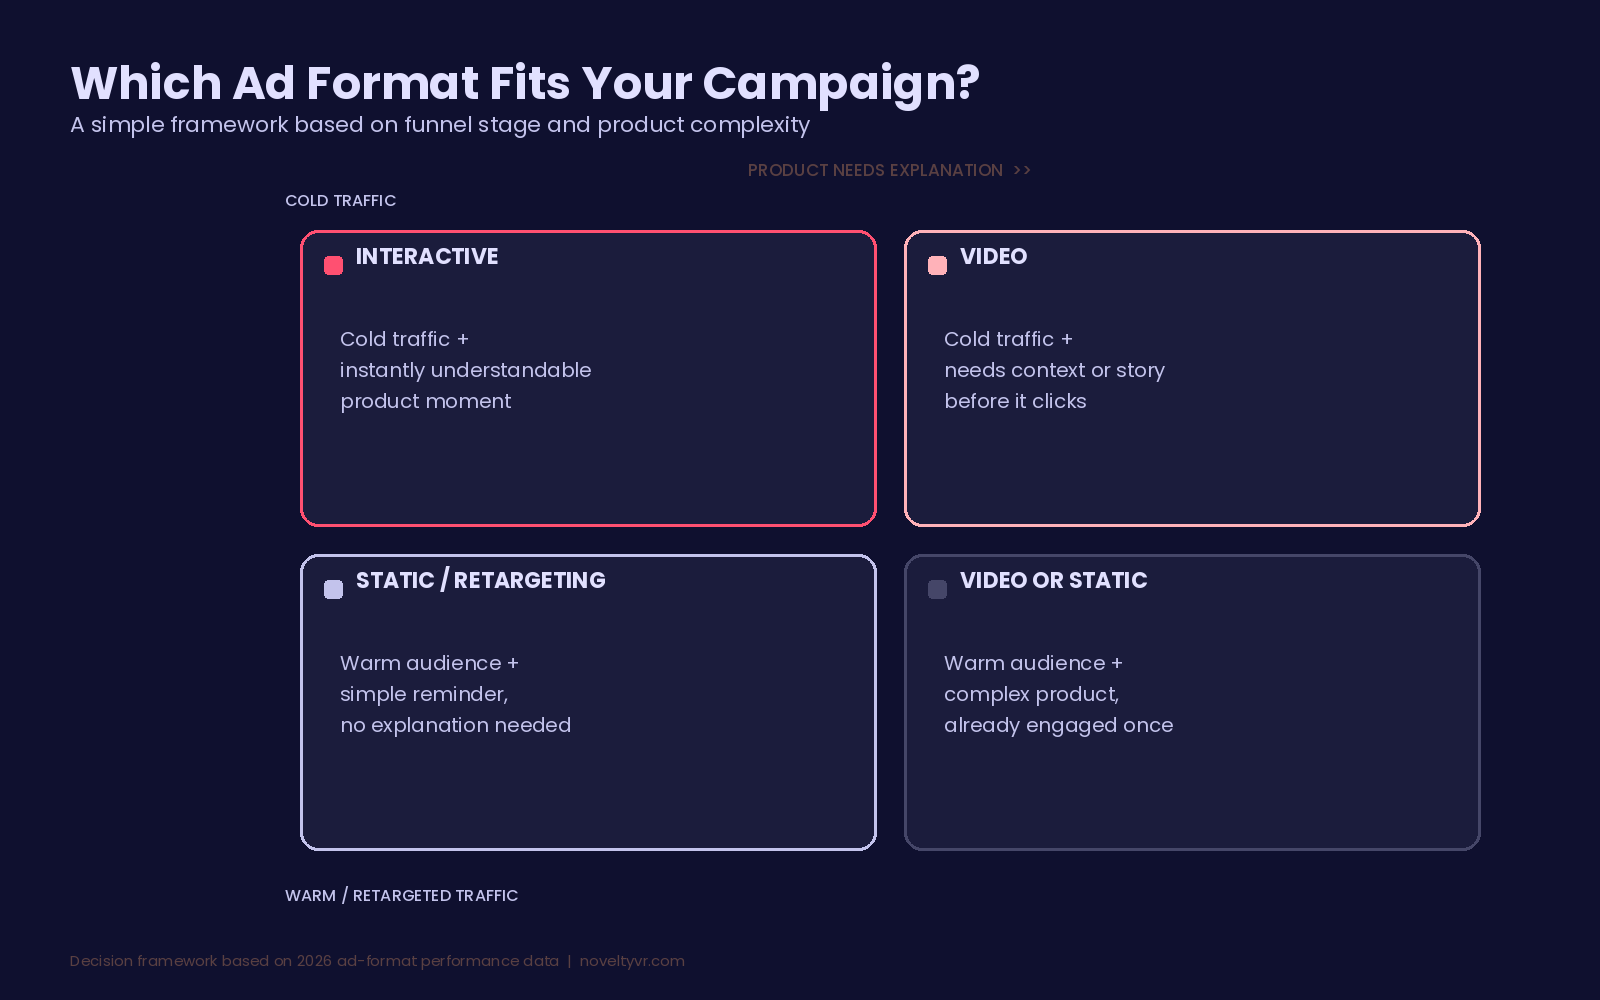
Most high-performing 2026 media plans aren’t choosing one format exclusively — they’re sequencing them: video for top-of-funnel reach, interactive for mid-funnel consideration where intent needs to be tested, and static for retargeting the audience that interactive already qualified.
9. FAQ
How do interactive ads compare to video ads in performance?
Interactive formats generally show 2–4x higher click-through rates and up to 3x higher conversion lift than standard video, along with 30–40% better post-conversion retention, because users self-select through direct interaction before converting.
What is the conversion rate improvement from interactive vs. static ads?
Interactive units frequently convert at multiples of static ad rates — shoppable video alone shows roughly 4x the conversion rate of static display in comparable placements, with playable and fully interactive formats showing even larger gaps in aggregate industry data.
What is a good engagement rate for an interactive ad?
15–30% is a healthy play/engagement rate benchmark for interactive formats. Below that range usually signals the interaction isn’t intuitive within the first couple of seconds.
Why are brands shifting from passive to interactive advertising?
Rising cost-per-action pressure, the decline of reliable third-party retargeting, and increasing ad fatigue with passive formats are pushing budgets toward formats that filter for genuine intent before the click — which interactive ads are structurally built to do.
Do interactive ads cost more than video ads to produce?
Usually yes, at the production stage. But because interactive formats reduce cost-per-acquisition at the media-spend level by pre-qualifying users, total campaign cost-per-outcome is frequently lower, particularly for sustained, higher-volume campaigns.
Should I A/B test interactive against video and static?
Yes — and track post-conversion retention alongside CTR and conversion rate, not just the top-line click number. A format that wins on CTR but loses on downstream retention isn’t actually the better format for most performance goals.
10. Key Takeaways
-
- Interactive ads outperform static and video on engagement, CTR, and conversion in nearly every 2026 benchmark reviewed, but the gap is largest specifically on post-conversion retention — the metric fewest teams track.
- Video still wins for pure brand storytelling, broad awareness reach, and products that need context before interaction makes sense.
- Static ads remain efficient for retargeting and low-budget validation, not for cold-traffic conversion at scale.
- Production cost and media cost move in opposite directions across formats — the format that costs more to build is frequently the format that costs less to run.
- The strongest 2026 media plans sequence all three formats by funnel stage rather than picking one exclusively.
11. Conclusion
None of this data says interactive ads are right for every placement, and any article that tells you otherwise is selling something. What it does say is that “interactive costs more, so we’ll stick with video” is no longer a complete argument — not when the downstream numbers on retention and cost-per-acquisition consistently favor the format that costs more upfront. The teams winning the format debate in 2026 aren’t the ones with the strongest opinion. They’re the ones who ran the numbers for their own funnel instead of assuming last year’s format still fits.
Curious what an interactive version of your next campaign could look like? Book a strategy call with NoveltyVR and we’ll walk you through the format mix that fits your funnel, budget, and timeline.